Terms Appearing On Storm Page That Need Background Information
synoptic = a summary of weather information plotted on a map for given day and time
synoptic meteorology = weather analysis and forecasting
"a complex of pressure, wind, clouds, precipitation "= weather system
cloud = A collection of condensed water droplets. The two rain clouds we will be discussing are cumulonimbus and nimbostratus.
synoptic charts = weather maps. Labeled, by convention, by time at Greenwich, England: Greenwich Mean Time (GMT or Z in 4 digits if hours and minutes and two digits if just hour) or UTC (Coordinated Universal Time). Subtract 8 hours to get to Pacific Standard Time.
cyclone = any area of low atmospheric pressure in which the winds are circling in a counter-clockwise manner in the Northern Hemisphere (in the same sense as the rotation of the earth, when viewed looking down at the Pole and which is encircled completelyt by at least one isobar on a weather map.
|
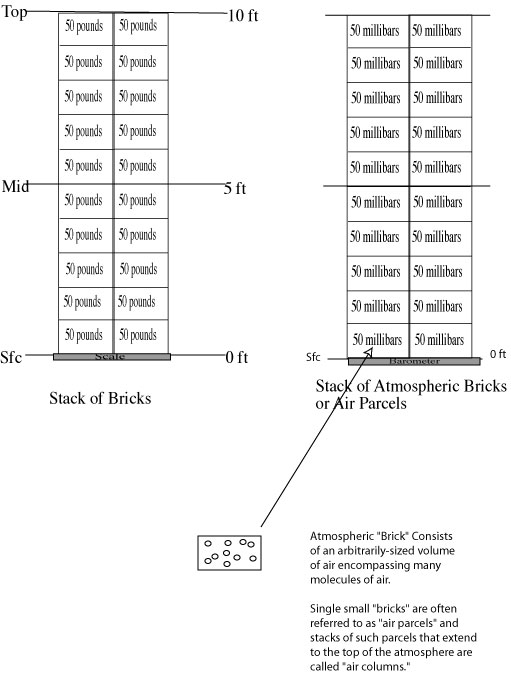
Atmosphere -- a mechanical mixture of gases held to the planet by gravity. The meteorologically significant gases in earth's atmosphere are: Nitrogen (~79%), Oxygen (~20%), Water Vapor (~1-4%), and Carbon Dioxide (~<<1%). This is about as far as we need to delve into this for this course. Meteorologists often describe the atmosphere as being made up of stacks of air parcels. These stacks are often referred to as columns of air, or air columns. |
|
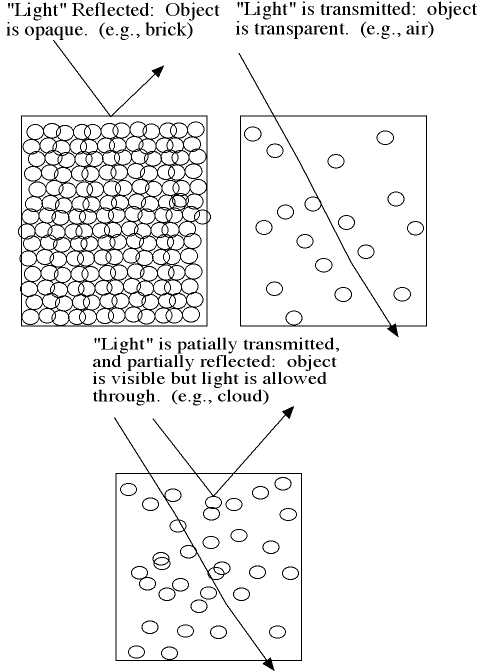
Disturbance (aka weather system) -- Any organized agitation of the atmosphere in which clouds, precipitation and winds are present. We need to discuss the reasons for the agitation, and also how and why clouds, precipitation and winds develop in order to understand storms. How do we "see" clouds? Our eyes are "sensors" that can detect the visible portion of the energy of the sun arriving at our eyes either directly, or by being reflected off of another object. Clouds are partial reflectors. |
|
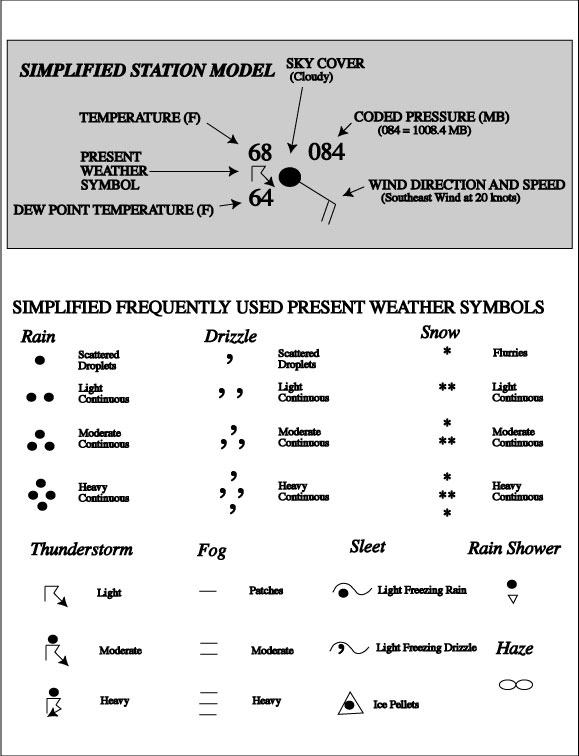
Pressure -- a measure of the weight of the atmosphere "pressing down" at a given elevation. Units in meteorology for pressure are millibars with average sealevel pressure being roughly 1000.0 mb. Pressures are coded on the surface weather map in the following manner: (a) drop the mb; (b) drop the decimal point; and, (c) plot the three right hand digits. So, a pressure of 1036.4 mb would be plotted as "364" to the upper right of the station circle. To decode a pressure observation on a surface weather map: (a) add the decimal point and mb; (b) then add a "10" or a "9". To accomplish the latter remember to keep in mind that on our planet sealevel pressure varies typically from 960.0 mb to 1050.0 mb (except in extremely intense cyclones and anticyclones). |
|
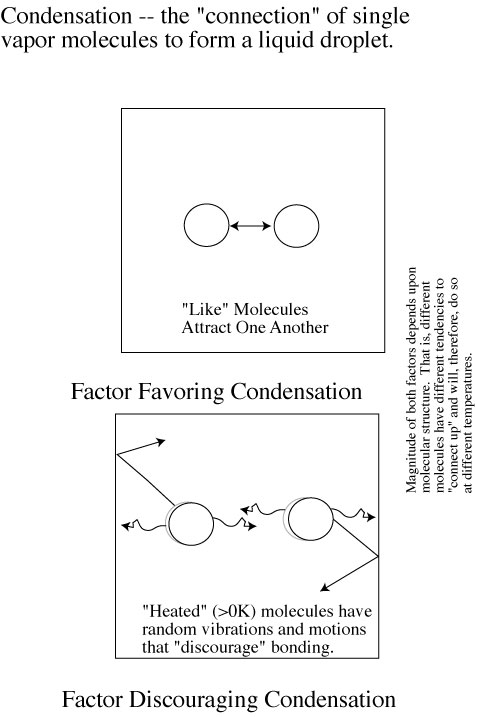
Precipitation -- any condensed (meaning, water vapor becoming liquid) or sublimed (meaning water vapor becoming ice) water vapor that achieves a size too large to be supported by the surrounding atmosphere and falls. Examples discussed in this class are: rain, drizzle, snow, hail and sleet. How do we "sense" or "detect" precipitation? Just as engineers can devise satellite sensors to produce cloud imagery, they have devised sensors to detect precipitation. This is called weather radar. |
|
Tropical -- An adjective used to describe weather systems that form in the the region of the world bounded by the Tropic of Cancer on the north (23 1/2 N Latitude) and by the Tropic of Capricorn on the south (23 1/2 S Latitude). |
|
Extratropical -- An adjective used to describe weather systems that form poleward of the Tropics. |