Understanding the National Hurricane Center Track
Forecast Cone.
During the Atlantic hurricane season, which lasts from 1 June until 30 November each year, we’ve all seen graphics on TV depicting the tracks of hurricanes as they move across the Atlantic Ocean or the Gulf of Mexico. All these graphics that you see on TV are based on data issued by the National Hurricane Center (NHC) in Miami. So, let’s look at the graphics that the NHC puts out to show the track and the “cone of probability”. Figure 1 below shows a typical NHC hurricane graphic and in this example, Hurricane Sandy is shown.

Figure 1: Example Graphic of 5-Day Track Forecast
Cone (Courtesy National Hurricane Center).
So, let’s look at all the information that is supplied in this very useful graphics. Firstly, the name of the storm is shown, i.e. Hurricane Sandy, the time the current graphic is valid for, i.e. Friday October 26, 2012 @ 11PM EDT. Current information regarding the tropical system is in the middle column. It shows the exact location in latitude and longitude, the maximum sustained winds (75mph) and the speed and direction that it is moving, i.e. Northwards at 7mph. On the graphic this location is shown by the orange circle with a black dot in it. The third column shows the expected forecast track of Hurricane Sandy, including the expected strength of the maximum sustained winds. “D” means the storm is expected to be a tropical depression with sustained winds of < 39mph, “S” means the storm is expected to be a tropical storm with sustained winds of between 39-73mph, “H” means the storm is expected to be a hurricane with sustained winds of between 74-110mph and “M” for a tropical storm to be a major hurricane (i.e. category 3 on the Saffir-Simson scale or higher) with sustained winds of > 110mph. So, in the example in Figure 1, Hurricane Sandy was expected to weaken and become a tropical storm, and remain so at 8PM Saturday local time and into Sunday morning at 8AM. However, Sandy was then expected to strengthen back into a hurricane by 8PM on Sunday night and remain so by 8PM on Sunday night.
You will notice that there is a white shaded “cone of probability” that surrounds the forecast track and forecast positions of the storm. So, what does cone mean? The NHC defines it as follows:
“The cone represents the probable track of
the center of a tropical cyclone, and is formed by enclosing the area swept out
by a set of circles (not shown) along the forecast track (at 12, 24, 36 hours, etc). The size of each circle is set so that two-thirds of
historical official forecast errors over a 5-year sample fall within the
circle. The circle radii defining the cones in 2017 for the Atlantic and
eastern North Pacific basins are given in the table below.
One can also examine historical tracks to
determine how often the entire
5-day path of a cyclone remains completely within the area of the cone. This is
a different perspective that ignores most timing errors. For example, a storm
moving very slowly but in the expected direction would still be within the area
of the cone, even though the track forecast error could be very large. Based on
forecasts over the previous 5 years, the entire track of the tropical cyclone
can be expected to remain within the cone roughly 60-70% of the time. “
Essentially
what this means is that as the time of the forecast increases into the future,
the actual position of the forecast track becomes harder and harder to predict,
so that the actual area increases as to where it could possibly be located. The
cone essentially shows the area the storm “may” occur in the future, with the
center of the cone having h highest chance or probability of occurring.
Therefore, the cone gets larger and larger the further you go out in time. In
the example shown in Figure 1, you can see the area is quite large for days 3
and 4 and shown by white dots. The NHC has statistics on the size of the radii
of the forecast cones as shown in Figure 2 below:
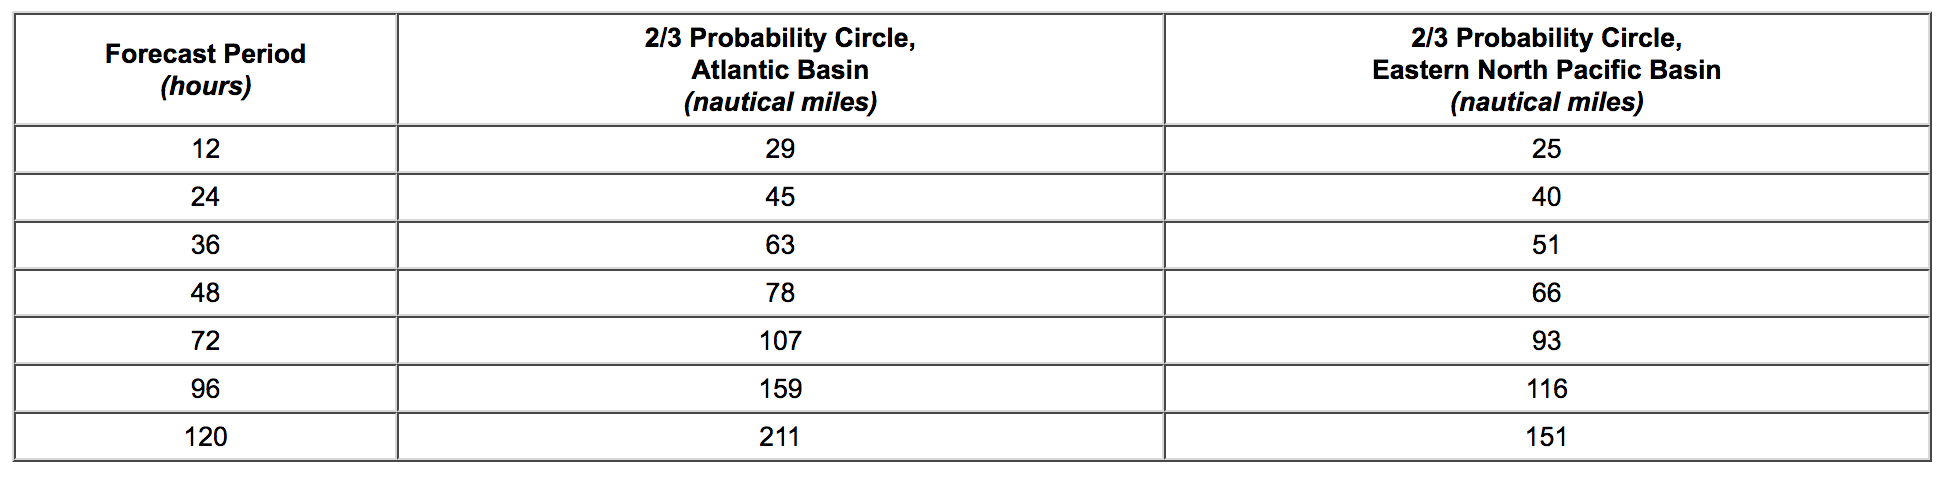
Figure 2: Radii of NHC forecast cone circles for
2017, based on error statistics from 2012-2016 (Courtesy the National Hurricane
Center).
Finally, the graphic shown in Figure 1
is also very useful in showing areas along the coastline of the United States
where National Weather Service (NWS) watches or warnings exist for either
Hurricanes or Tropical Storms. What’s the difference between a watch and a
warning issued by the NWS?
A Tropical Storm Watch
is issued when a tropical cyclone containing winds of 39 to 73 mph or higher
poses a possible threat, generally within 48 hours. These winds may be
accompanied by storm surge, coastal flooding, and/or river flooding. The watch
does not mean that tropical storm conditions will occur. It only means that
these conditions are possible. They are denoted by
yellow along the coastline in the hurricane graphic.
A Tropical Storm Warning is issued
when sustained winds of 39 to 73 mph or higher associated with a tropical
cyclone are expected in 36 hours or less. These winds may be accompanied by
storm surge, coastal flooding, and/or river flooding. They are denoted
by blue along the coastline in the hurricane graphic.
A Hurricane Watch is
issued when a tropical cyclone containing winds of 74 mph or higher poses a
possible threat, generally within 48 hours. These winds may be accompanied by
storm surge, coastal flooding, and/or river flooding. The watch does not mean
that hurricane conditions will occur. It only means that these conditions are possible. They are denoted by pink along the coastline in
the hurricane graphic.
A Hurricane Warning is
issued when sustained winds of 74 mph or higher associated with a tropical
cyclone are expected in 36 hours or less. These winds may be accompanied by
storm surge, coastal flooding, and/or river flooding. A hurricane warning can
remain in effect when dangerously high water or a combination of dangerously
high water and exceptionally high waves continue, even though winds may be less
than hurricane force. They are denoted by red along the coastline in the
hurricane graphic.
And right on cue, we have a newly formed tropical storm called Franklin
as seen in Figure 3 below. It has formed in the NW Caribbean and is the 6th
named storm of the season. Only 4 other years have had 6 named storms by the 6th
of August (1936,1959,2005 and 2012). It is not expected to make landfall over
the United States at this time as shown by the track.
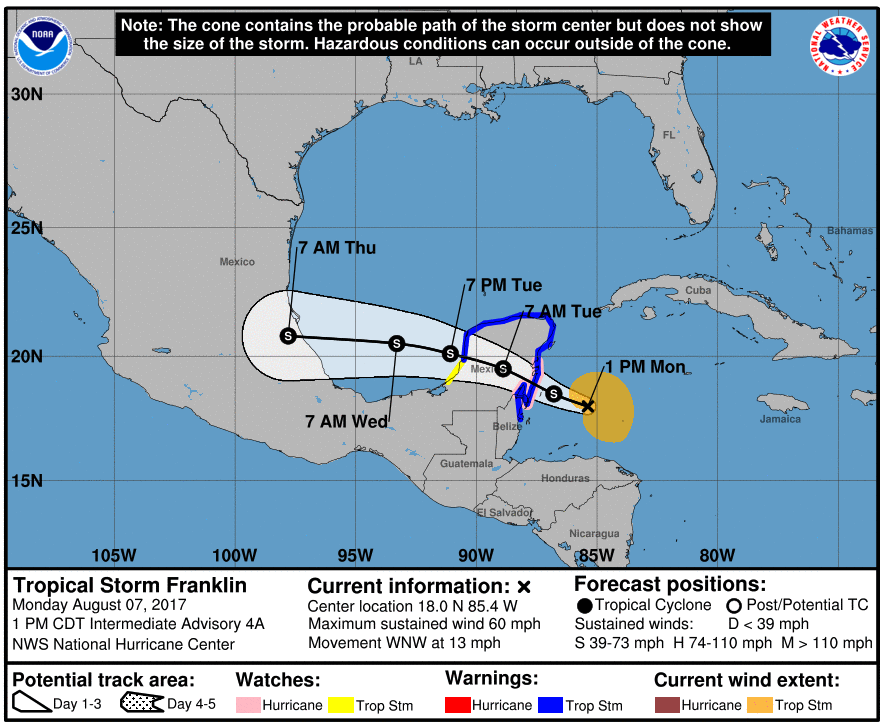
Figure 3. Expected track of Tropical Storm Franklin.
Although hurricane tracks on TV are often a lot simpler to look at, you
now know exactly where the information originates and should be able to view
the official NHC hurricane graphics and understand them! Head on over to their
website to view these graphics for yourself at http://www.nhc.noaa.gov/.