Educational Information
BERGWINDS
Bergwinds usually occur when a strong high pressure exists south or south-east of the country and when a high pressure is also situated over the country. These conditions usually only occur in winter, but sometimes in summer too, hence bergwinds are mainly a autumn-winter-spring phenomenon. Since air rotates anti-clockwise around a high pressure in the southern hemisphere the wind direction to the north of the high pressure will be easterly or north-easterly, especially along the west coast of southern Africa. The bergwinds will usually start blowing along the Namibian coast and the first indication of bergwinds is a rise in temperature, sometimes this rise can be rapid. In the winter of 1985 in Cape Town, the temperature rose from 3°C at 07:00 in the morning to 27°C by 07:35 that SAME morning. This is not a common occurrence, but rather an extreme case. Since air in a high pressure descends and warms up as it descends it stands to reason that the off-shore winds will be warm to hot and the temperature will usually rise about 10 degrees Centigrade from the interior of SA to the coast. So the temperature at Upington may be 20°C, while at Alexander Bay it may be over 30°C. At the same time a coastal low will develop along the coast. Off-shore flow ahead of the coastal low is usually easterly to north-easterly in direction along the west coast and north-westerly along the east coast. Humidities are usually very low, sometimes as low as 5%, usually between 10-40%. 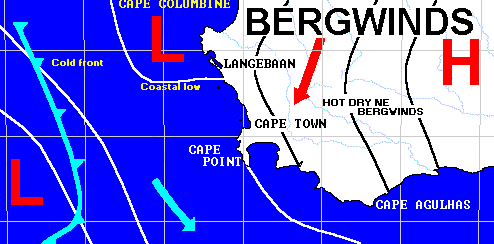
The coastal low moves down the west coast and around the Cape Point and then up the east coast of South Africa until it fills up near Maputo in Mozambique. The bergwinds obviously follow the same pattern. The highest official temperature ever recorded in South Africa (51.5°C) was recorded one summer during a bergwind occurring along the Eastern Cape coastline. The bergwinds are usually followed by a cold front in winter.
COASTAL LOWS
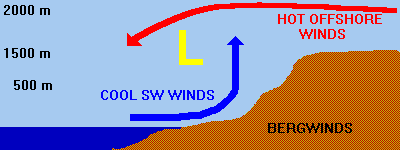
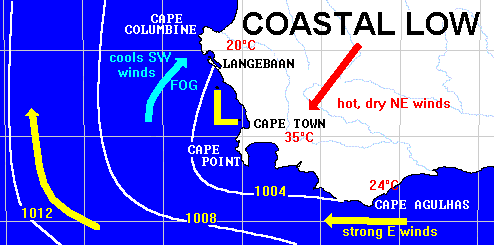
Air moves off the coast at a height of approximately 1500m. This creates a relative "vacuum" at the surface as air rises to replace the air that is moving away from the coast. In a low pressure system, air rises clockwise in the southern hemisphere and the resultant circulation around the low pressure is the same. Hence, prior to the presence of a coastal low, the winds are usually offshore and in Cape Town they are usually in the form of hot, dry NE bergwinds. Once the coastal low moves through the area, the hot, dry winds are replaced by cool, moist NW-SW winds and usually fog. Coastal lows usually precede cold fronts in winter. COLD FRONT INFORMATION
Cold fronts are mid-latitude phenomena - meaning they are not tropical in nature and occur mostly south of 25°S or north of 25°N. The word "front" means "boundary" and a cold front is a boundary between cold and warm air, where cold air is under-cutting (moving under) warmer air ahead of it. Fronts usually form far south where the westerly wind-belt meets the polar easterlies - somewhere near 60°S. A disturbance may cause the cold easterly air to invade the warmer westerly air and since cold air is denser, will, move under the warm air. Warm air could also invade the cooler air and ride up over it since, as you should know, warm air is less dense and it is force to rise by the colder air beneath it, it will want to rise further and as it does, air that rises, cools and as it cools, any water vapor in the atmosphere will condense and form clouds. It is suggested that you familiarize yourself with synoptic chart terminology before reading this article unless you know basic meteorological terms. 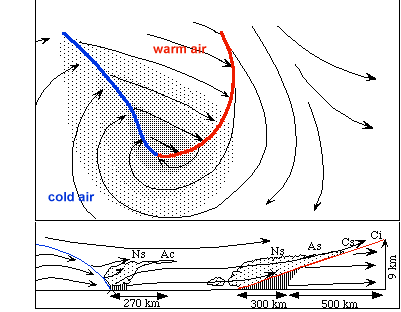 FIG.1 Formation of a cold front in the southern hemisphere. Below is a cross-section through a cold (blue) and warm (red) front - clouds are Ns (nimbostratus), Ac (altocumulus), As (altostratus), Cs (Cirrostratus), Ci (Cirrus). HOWEVER, here is the BIG catch. Most times these cold or warm air invasions into the warmer westerlies die out and no low pressure cell forms etc...WHY ? Well, the mid-latitudes are controlled by what is know as a "top-down" process...a "what ?" I hear you ask.... 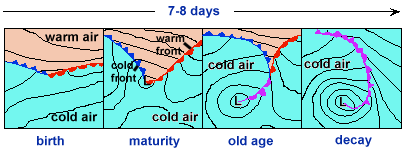 FIG.2 Formation of a cold front in the southern hemisphere. 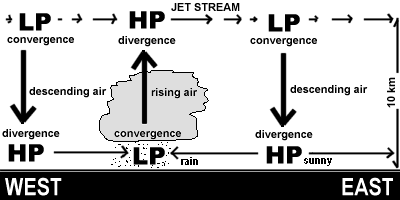 FIG.3 The "top-down" process. The jetstream is no different - now where it really speeds along in the upper atmosphere, meteorologists refer to it as a "divergent" area, and where it slows down, a "convergent" area. Once again, think about the traffic analogy - when cars on a highway move away from a congested area, the cars start getting spaced further apart as they pick up speed - i.e. the cars are diverging from one another, and where they encounter a snarl up, they become closer together and "converge" on one another.... Where air in the upper atmosphere diverges it really means that air is leaving a certain area faster than it can be replaced, and somehow, it needs to be replaced ASAP - most of it is replaced from the upper atmosphere, but some of the air is replaced from the surface, almost like a giant vacuum cleaner in the upper atmosphere sucking up air from the surface. See figure 3 above. Now, lets go back to the original scenario that I explained on the surface, i.e. the cold air from the easterlies undercutting the warm westerly air...the warm is forced upwards since it is less dense....NOW here is the connection - IF the upper atmosphere /jetstream is DIVERGENT, i.e. needing air to replace from the surface, it will AID the warm air at the surface (that has been forced upwards by the cold air) to RISE to the upper levels and the stronger the upper-level divergence the more air that is needed from the surface and the faster the air will rise and bingo - a LOW PRESSURE cell is formed on the surface along the boundary between the cold polar easterly air and the warmer westerly air. This connection between the upper and lower atmosphere is called the "top-down process" - since a low pressure will not develop sufficiently into a deep low pressure and cold front if the upper atmosphere does not aid it with strong divergence aloft. 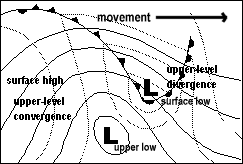 FIG.4 The upper and low circulations super-imposed - dashed lines are surface isobars (equal pressure lines) and solid isobars are of the upper-level circulation. Hence, sometimes the jetstream in autumn in the southern Atlantic is such that active cold fronts may be formed in the southern Pacific Ocean west of Chile and move eastwards and appear strong on satellite images/1STWX/old in the mid Atlantic but weaken and die out or move south of the country owing to the way the jetstream is aligned in the upper atmosphere.....So, to cut a long story short, at certain times of the year, the jetstream is further south (in summer) and most of the cold fronts move south of the country, and during winter, they occur further north and CT gets a lot more rain. However, sometimes for a few days or even weeks, the jetstream may align itself such that cold fronts will weaken as they approach CT frustrating forecasters to no end.... EL NIÑO / LA NIÑA INFORMATION
INVERSION LAYERS
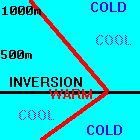
A surface inversion layer is a layer within the first 1500m of the atmosphere. It occurs when a air within a high pressure descends and as it descends, it warms the atmosphere, much like a bicycle pump warms up when you pump up a wheel. When air is compressed it will warm up. As the air descends from heights of about 12km it will warm and the warmest air will be found at this inversion layer which can be several meters thick. The air temperature then cools towards the surface. 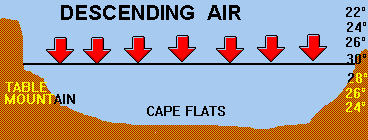
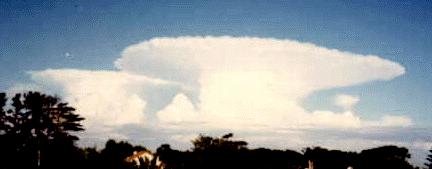 Sunday, 3rd November 1985, taken in Constantia, Cape Town, looking east towards the Boland Mountains.
© Kevin Levey
Sunday, 3rd November 1985, taken in Constantia, Cape Town, looking east towards the Boland Mountains.
© Kevin LeveyTHE SYNOPTIC CHART
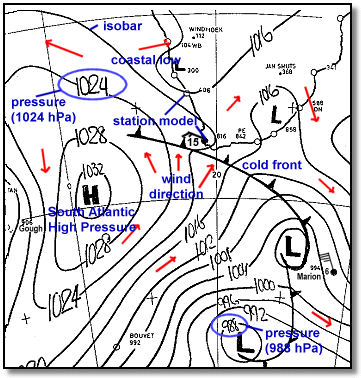
The answer is that in reality, near the surface, air actually does flow across the isobars owing to friction between the air and the surface of the earth. Hence, flow is across the isobars towards centers of low pressures and away from centers of high pressures. In the southern hemisphere, the flows clockwise around low pressures and counter-clockwise around high pressure cells. A pressure gradient exists between high pressure cells and low pressure cells. Think of a high pressure being a mountain and a low pressure being a valley - if you drew a line from the highest point of the mountain to the lowest point of the valley you would have one side of a triangle of a right-angle triangle, and little trigonometry would tell you that the ratio of the height to the horizontal distance is the gradient, the the higher the mountain and lower the valley, the steeper the gradient. Well, the stronger a high pressure is (i.e. the higher the pressure) and the deeper a low pressure is, the stronger the gradient will be, or if the distance is shortened between a high pressure and low pressure, so too, would the pressure gradient be increased, all resulting in stronger winds . On a synoptic chart, isobars that are closely packed together indicate stronger winds, and vice versa. On the map above, the strongest pressure gradient exists between the South Atlantic High pressure and the deep low pressure (988 hPa) near the bottom of the map and strong SW winds will be found in the region between them. The red arrows indicate the direction of the wind, and remember, wind is named where it blows from. THE STATION MODEL
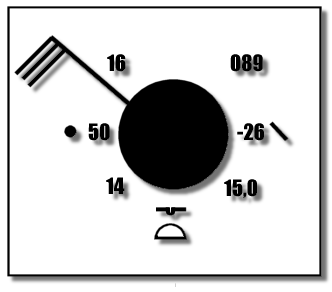
dry bulb temperature : 16C dewpoint temperature : 14C atmospheric pressure : 1008.9 hPa pressure tendency in last 3 hrs : steady fall of 2.6 hPa wind direction : NW windspeed : 30 knots cloud cover : 8/8 (or 100%) current weather : rain cloud base is at 100m clouds : cumulus and stratocumulus rainfall past 3 hours : 15,0 mm visibility : 5km Wow - all that from a simple little diagram - yes, it is that powerful. Usually, not all the data is shown, and only temperature, current weather and pressure, cloud and wind data is shown. Let me explain how I deciphered the station model so that you can become an expert at interpreting synoptic charts. Firstly let's pretend the circle is like a clock, so that I can use "the time" as the locator for data.... Let's start at 11 o'clock - the dry bulb temperature is the actual temperature of the air and is given in centigrade in South Africa and Fahrenheit in other countries like the USA. At 7 o'clock we have the dewpoint temperature, which is the temperature at which water vapor will condense (into cloud/fog) if the air is cooled to that temperature. It is a useful indicator as to how much moisture is in the air - the closer the dewpoint is to the actual temperature, the more humid the air is. 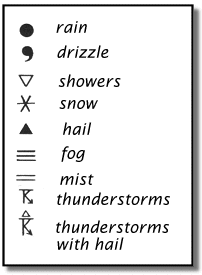
Also at 9 o'clock we have the visibility shown in kilometers. At 2 o'clock we find the air pressure given in hecto Pascals (used to be millibars, but the metric system calls for it to be expressed in metric units - 1mb = 1 hPa). Air pressure is expressed using one decimal place, i.e. 1008.9 hPa and the last three digits are used, so for example: 1008.9 = 089, 1033.5 = 335, 995.3 = 953 BUT, what happens if the pressure is 1095.3 hPa you ask would that not mean 953 also ?....don't worry - the highest pressure ever recorded is about 1080mb and the lowest about 880mb, and neither were recorded in SA, so we never have to worry about not reading the correct figure from the pressure data on the station model....to complicate things a little, over the land (non-coastal stations) the figure at 2 o'clock actually does not represent a pressure reading, but rather the height above sea-level that a certain pressure level is found - for example, over the land a number like 546 on the 850 hPa chart represents a height of 1546m where the 850 hPa pressure (surface) is found in the atmosphere. 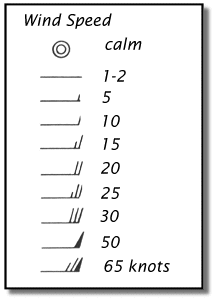
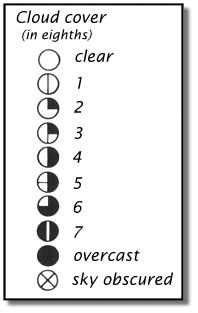
Wind direction is always given where the winds blow FROM, i.e. as though the winds blow INTO the station, so in the example above, the wind direction is NORTH WEST (i.e. the wind is coming FROM the NW or 315°). The speed is represented by "feathers" or "barbs" that are usually perpendicular to the stick. Each barb is 10 knots and a knot is one nautical mile per hour which is equal to 1.8 kilometers per hour. So in the example above the wind speed is 20 knots or 36 km/h. Half a barb is 5 knots. At 50 knots, windspeed is indicated by a solid triangle as shown to the left. Finally, the cloud cover is shown by how much of the station model is filled. See the examples above. SUMMER SEA TEMPERATURE DIFFERENCES AROUND CAPE TOWN
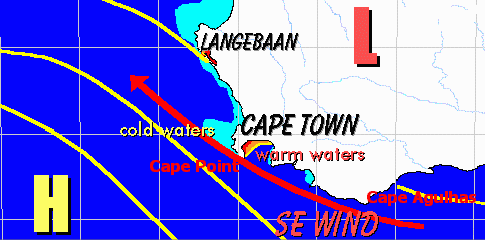 However, let's first look at the action that the wind performs on the ocean surface. Without getting too theoretical, it is is sufficient to know that when wind blows over an ocean surface, a stress is induced on the ocean surface. In short, this means the wind "pushes" or "pulls" the surface layers of the water along with it. Hence, if we apply this to the Cape Town situation in summer the two consequences are :
SOUTH EASTER INFORMATION
The South-Easter is a fair weather or trade wind. It originates from the South Atlantic High (SAH) pressure system. The SAH moves further southwards in summer as the westerlies retreat polewards. The SAH then ridges south of the country and joins up with the South Indian High pressure system often forming a band of high pressure to the south of the country during summer. The SE wind varies in speed from 10 knots to about 70 knots (20-125 km/h) at times during gale-force wind events. The South Easter's speed is directly proportional to the pressure gradient that exists between the SAH and the low pressure trough over the interior of South Africa. The diagram below shows the general summer circulation affecting the SW Cape. 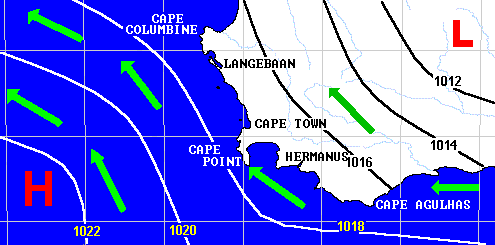 During extreme SE conditions wind speeds of up to 160km/h (100mph) have been measured in Table Bay ! Double-decker busses have been blown over, not mentioning the number of pedestrians hanging on to poles for dear life ! The SE wind is generally not a blustery wind such as the north wester and generally is fairly uniform in speed. It is most active in late spring during the month of November, when GALE-FORCE SE winds have been known to last for up to a week on end. Before we continue, we need to understand what an inversion layer is. DEEP SOUTH EASTER CONDITIONS The weather of Cape Town varies on a basic 7-day cycle. During summer the SAH starts to ridge south of Cape Town and the SE wind will be fairly strong over the entire area, strongest along the coast. At this stage we have what is known as a DEEP SOUTH EASTER. The inversion layer occurs at a height greater than the height of Table Mountain, i.e. >1000m above the ground. 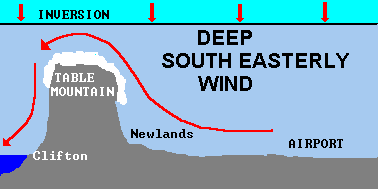 The map below shows that the strongest SE wind occurs along the SW coast and blows over the entire Peninsula. These conditions usually last for about 1 to 4 days when a transition occurs to SHALLOW SE CONDITIONS described below. 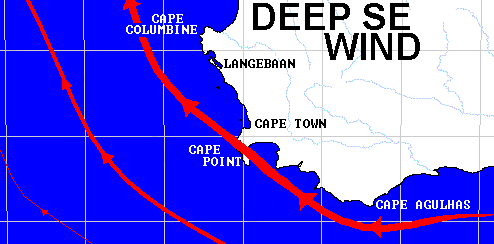 SHALLOW SOUTH EASTER CONDITIONS After 1 to 4 days of DEEP SE conditions the SAH ridges further south of the country and as it moves closer and closer to CT, the inversion layer also descends closer to the ground. The inversion layer is lowest in the centre of a high pressure, so it makes sense that as the ridging SAH moves closer to CT, the inversion layer drops lower and usually will drop lower than 1000m above sea-level. This means that the inversion layer is lower than the height of Table Mountain as seen in the diagram below. 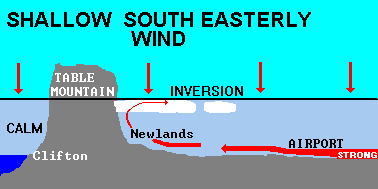
Towards the end of the ridging process when the SAH has ridged well south of the country and the inversion layer is at it's lowest altitude, the various effects on the wind cause extremely strong winds at Cape Point and mostly calm conditions elsewhere in the Peninsula and SW Cape. A shallow NW return flow often is found from Clifton northwards to Table Bay under these conditions. It is usually also very hot as the wind has died down. Shallow SE conditions usually last from 1 to 3 days. Some cloud, usually stratus, may develop along the eastern flank of Table mountain as shown in the diagram above, but NO Table Cloth is present. 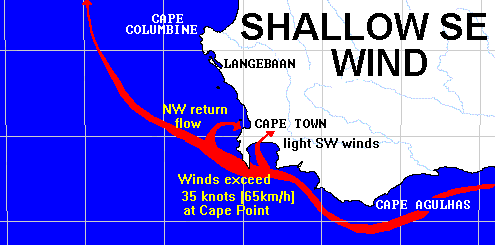 The diagram above shows where the SE is the strongest during SHALLOW SE conditions. The return NW flow into Table Bay is evident as is the very strong SE wind at Cape Point which often reaches speeds of up to 100km/h at times in summer. THE BLACK SOUTH EASTER The Black South-Easter is a much misinterpreted phenomenon. It is referred to as a "BLACK" SE event when the SE wind is blowing, usually rather strongly, and it is raining at the same time. A Black SE usually is caused by a deep low pressure system over the SW Cape both in the upper air and on the surface and a very strong/intense SAH south of the country. The Laingsburg Floods and the Easter of 1994 are prime examples of Black South-easters in Cape Town. The tight pressure gradient between the systems cause the wind and the low pressure systems produce the rain. These Black SE events usually occur during spring and autumn, the months when the incidence of cut-off low pressure systems are high. TEPHIGRAMS
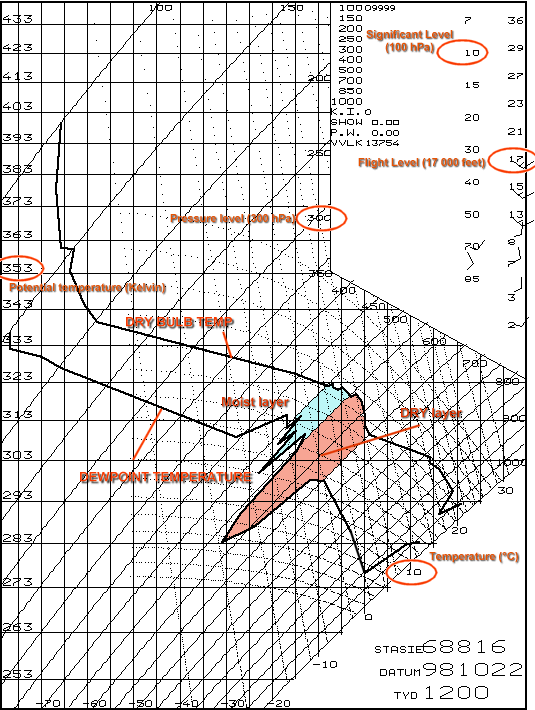 Tephigram for Cape Town, South Africa. Let's look at individual features of the tephigram : 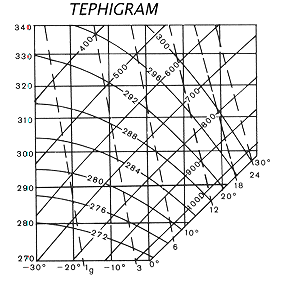
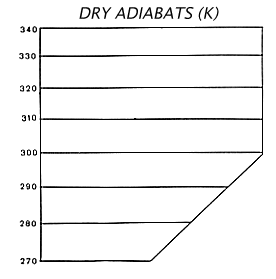
Bergwinds are the best examples of adiabatic processes ! It is the reverse of the process of a parcel of air rising, expanding and cooling - a parcel of air brought to the surface from higher in the atmosphere, will compress and the temperature will increase at 10°C per 1000m as it descends. So how does this help me on the tephigram. Well, the process just described with bergwinds, is useful - air at a high altitude if brought to 1000m will have a certain temperature, called the potential temperature which is an indication as to the amount of energy in the atmosphere. How would you calculate potential temperature - well, we will explain at the end... 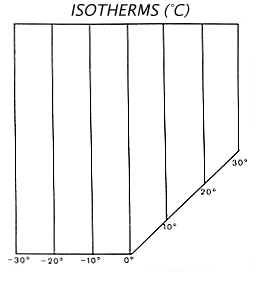 These lines represent the temperature of the atmosphere.
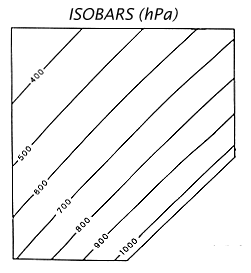 These lines represent the pressure of the atmosphere.
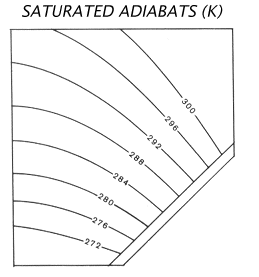
However, let's say that we want to know how much energy there is in the atmosphere (which is always moist) and let's assume that we choose a parcel of air in a cloud and bring it to 1000m. Well, it will warm at 6.5°C per 1000m, and not at 10°C per 1000m since as it warms the water will evaporate, a process that needs heat to occur, so 3.5°C per 1000m goes into evaporating the water back into vapour. When that parcel finally reaches 1000m the temperature it now has is known as the equivalent potential temperature and is a better measure of the energy in the real atmosphere, than the potential temperature described before. 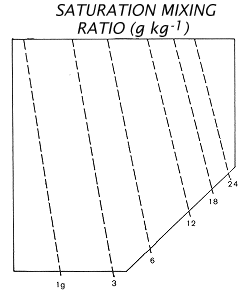
So, we release a weather balloon with a radiosonde that collects the following data every 10 seconds or less as it rises : We plot the temperature measured by the radiosonde against the pressure it was measured at, and soon we will have the temperature line you saw on the first figure. We also then plot the dewpoint line which is calculated from the humidity measurements. Finally the wind data is plotted at certain significant levels (i.e. 850 hPa, 700 hPa, 500 hPa, 400 hPa, 300 hPa, 200 hPa and 100 hPa) or at predetermined flight levels and these winds are plotted in the same manor that station model winds are plotted. Many, many different atmospheric variables essential to forecasting can be calculated from the tephigram. These include stability indices, thunderstorm likelihoods, inversions, how quickly thunderstorms are likely to develop in the day, how strong the SE wind will blow in Cape Town and many other variables. The tephigram in the first figure, shows a moist layer and a dry layer - where the two dark lines are closer together, the more moist the atmosphere, the further apart, the drier the atmosphere. Needless to say, to try and explain exactly how these variables are calculated, would only be of interest to pilots and meteorologists, and are difficult to explain in the context of this article. WINTER RAINFALL DIFFERENCES AROUND CAPE TOWN
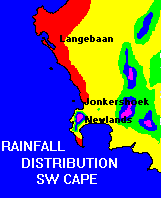
So what causes these great differences in the rainfall ? Topography, i.e. the mountains play a very significant role in the distribution of rain and also the wind direction. Usual geographic theory tells us that when a moisture laden onshore wind encounters a mountain it will rise and moisture will condense and rain will occur on the windward side. The leeward side remains dry as the moisture is not able to rise up and over the mountain, which acts as a barrier. Hence the leeward side is usually very dry. This is typical of the George-Oudtshoorn area. This is depicted in the diagram below. 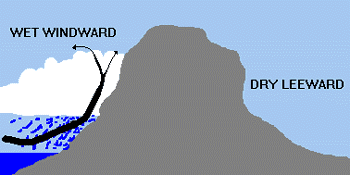
However, let us take the usual scenario in Cape Town in winter when a fresh to strong north westerly wind is blowing. Since Table Mountain is not too high, the airflow is able to go up and over the mountain. Table Mountain therefore acts as a trigger mechanism, i.e. it forces air to rise up higher than it would have if it had not encountered the mountain. As it is forced up, the moisture condenses and most of the rain falls over Newlands, where the uplift is strongest. 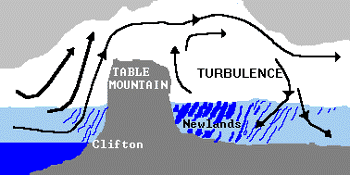
As the airmass moves away from the mountain the upward forcing is no longer there and the rainfall also decreases proportionally as one moves away from the mountain. This is why Newlands and most areas such as Wynberg, Constantia and Claremont get so much rain in winter compared to other regions in and around Cape Town. Also, the mountain causes great wind turbulence in it's wake, hence these same areas also get some of the strongest winds in the Peninsula during really bad north westerly gales. |
||||||||
|
CURRENT CONDITIONS
|